

Our Data Publications
Downloadable data, interactive tools, and analysis on college value, earnings, and economic mobility.
Blog
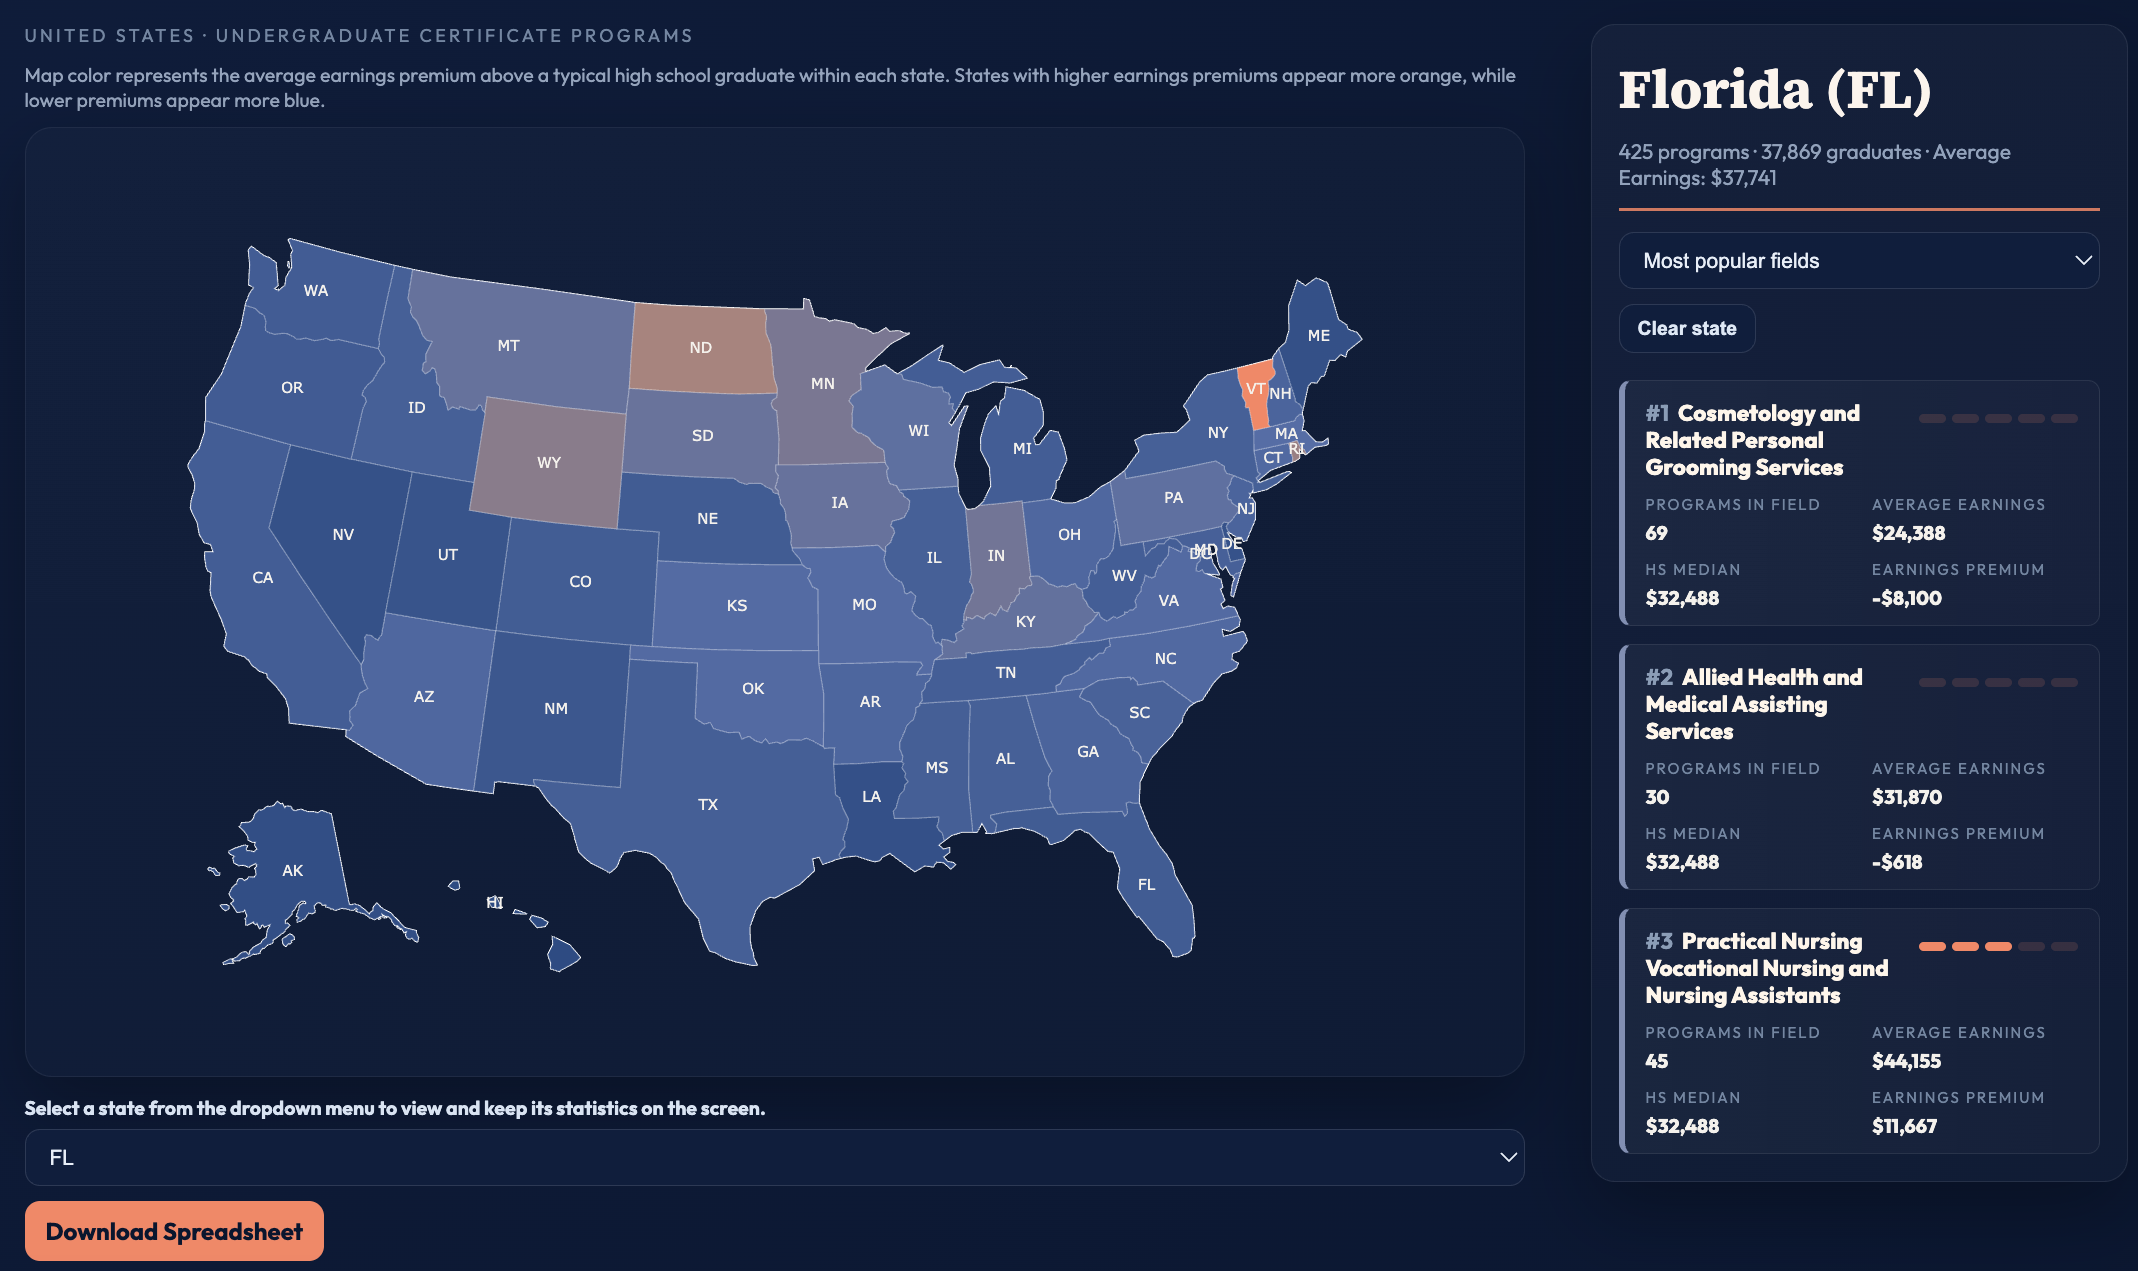




A state-by-state analysis of what certificate, associate’s, and bachelor’s degree graduates earn compared with high school graduates. Explore the State Snapshot for a one-page briefing on any state, or The Payoff Map to compare every field and credential across all 50 states, D.C., and Puerto Rico.
A one-page briefing for any state. See what certificate, associate’s, and bachelor’s degree graduates earn compared with high school graduates, and how the state ranks against the 50 states and D.C.
An interactive map and table comparing what graduates earn across 580 types of credentials in all 50 states, D.C., and Puerto Rico. Filter by field of study and credential level to see where college pays off most.
As college costs rise and confidence in its value declines, families need clear information about what degrees deliver. This report analyzes earnings for 276,963 graduates across 2,958 programs and 386 California institutions to show how outcomes vary by field and credential.
The Certificate Earnings Explorer includes actual earnings outcomes for 5,592 certificate programs, representing more than 462,000 graduates across all 50 states and the District of Columbia.
The HEA Group has analyzed all 32,578 undergraduate programs in the Education Department’s new data determining which college programs may remain eligible for federal student loan participation.
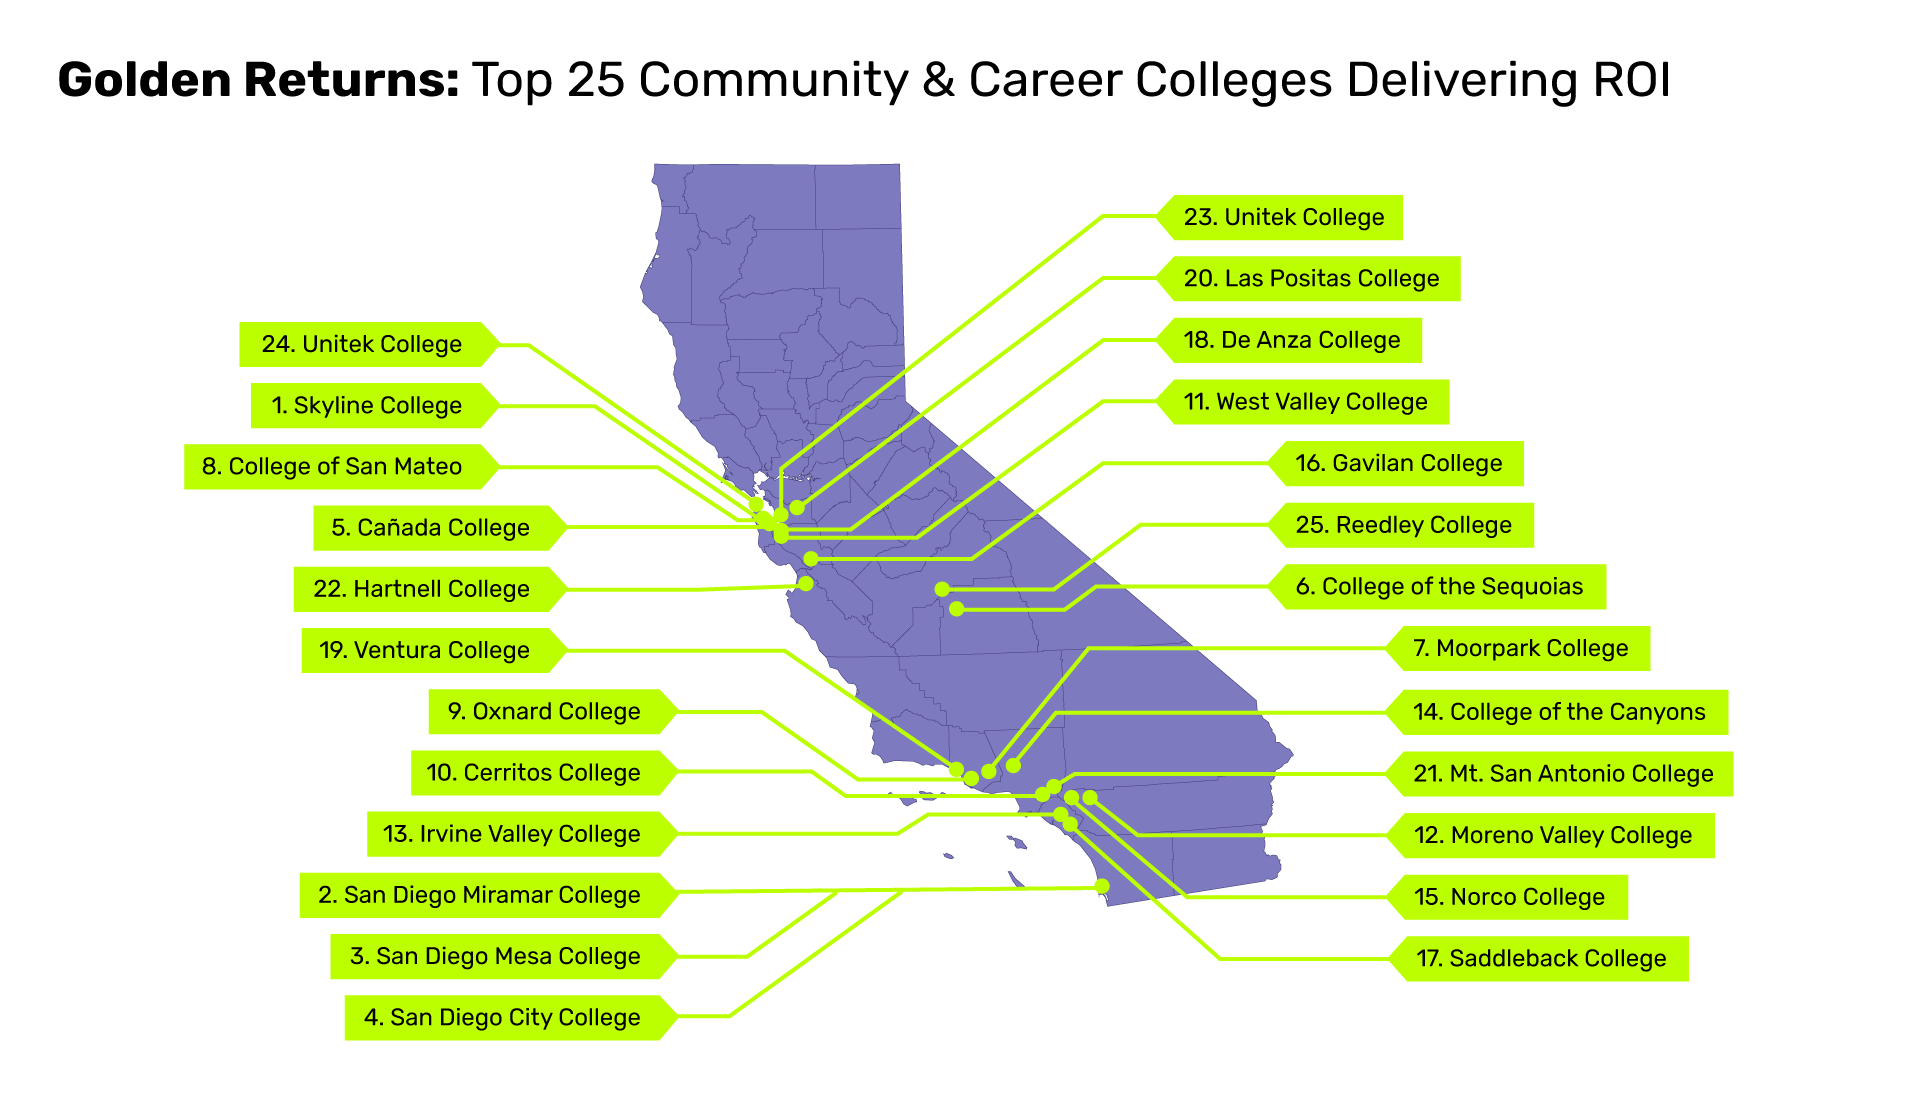
A first-of-its kind regional analysis of California’s community and certificate-granting colleges shows that while some institutions offer a rapid economic return to students, far too many provide little to no ROI, especially in underserved regions of the state.
College Futures Foundation and The HEA Group’s inaugural California Mobility Index (CMI) covers 82 four-year institutions enrolling 785,576 undergraduates, describing the extent to which each drives upward mobility among underserved learners.
This report examines individual college programs and how long it takes graduates to recoup their educational costs within specific fields of study, giving policymakers, college leaders, and researchers new data on how well programs serve learners economically.
In this analysis, we explore whether California colleges deliver on their promise for people from low- and moderate-income backgrounds, examining how long it takes these students and families to recoup their educational costs.
In this paper, we examine the economic outcomes students obtain by pursuing a postsecondary credential in the United States, looking at several minimal economic benchmarks to see how many colleges exceed, or fail to meet, basic financial outcomes for their students.
In the newest issue brief between NASFAA and the HEA Group, we explore the extent to which college completion impacts student loan repayment. The result? Those who did not complete college now owe $918 million more than they borrowed in the first place.
In this report, the HEA Group and Student Defense analyzes the five most popular master’s and doctoral programs awarded in the United States and examines whether there are differences in how much students earn—and how much they owe—based on their specific course of study.
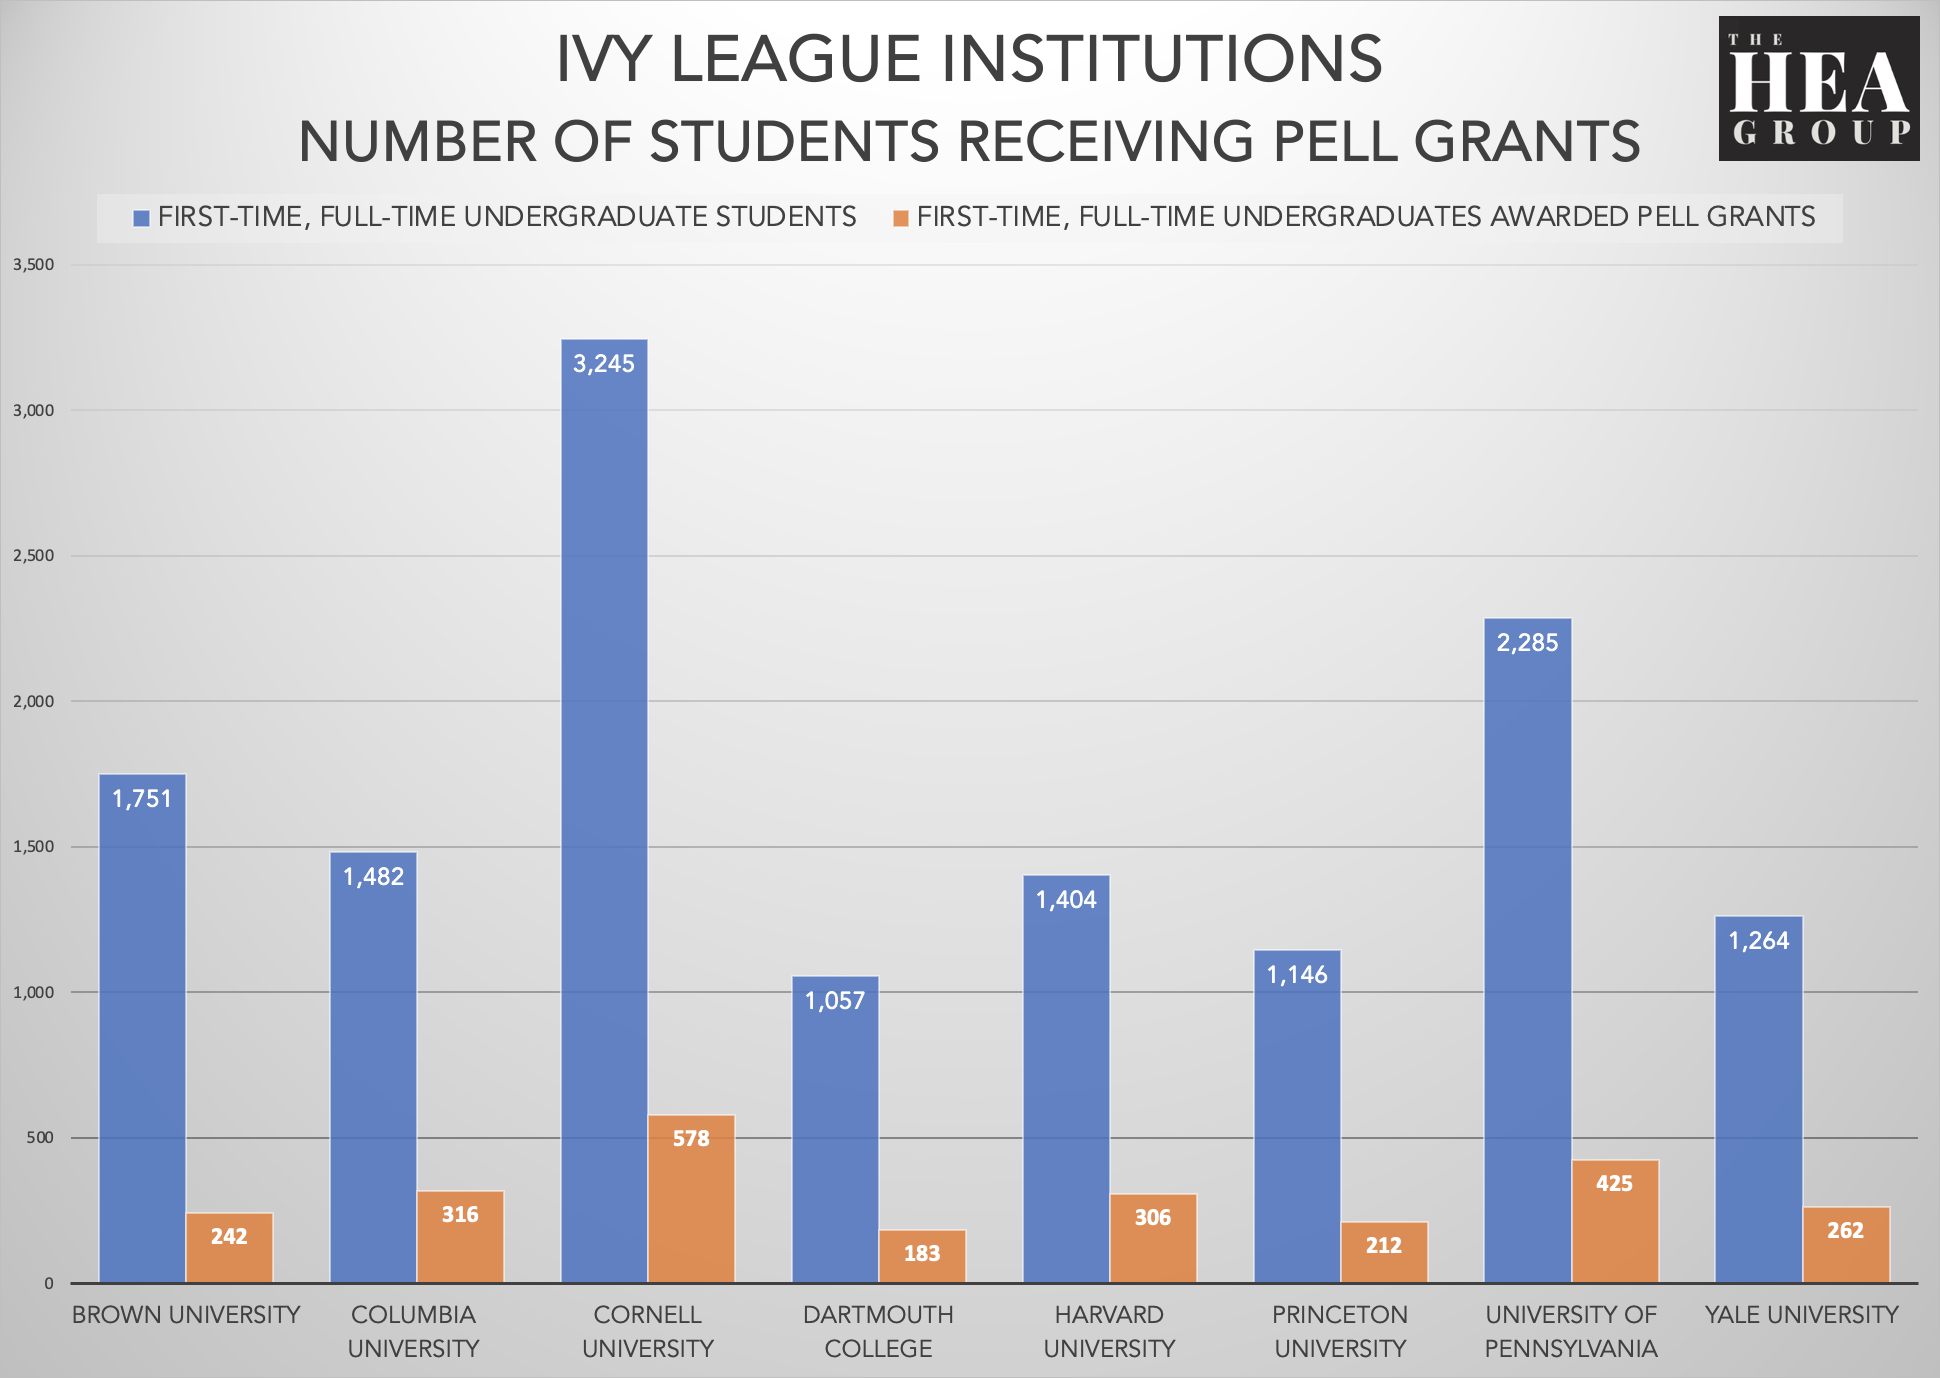
In this analysis, we explore how Ivy League institutions can expand opportunity for students from low- and moderate-income backgrounds, showing that even a modest 5% increase in these students could pay big dividends.
Roughly one in three American graduate schools leave students owing more than they originally borrowed, according to an analysis by The HEA Group and Student Defense. At seven of the worst performers, students racked up more than $100 million in excess debt in five years.
Every year, American taxpayers provide over $100 billion to help subsidize students’ higher education endeavors. Do you ever wonder where those dollars actually go? Our latest data show the total amount of federal grants and loans that flow to institutions every single year.
Almost everyone who pursues a postsecondary education expects greater employability and financial security, but the field of study you choose affects both. In our latest data download, explore over 200 college majors and how much graduates earn four years later.
The top reason students attend college is greater employability and a financially secure future, and the major you choose often matters more than the college. In this data download, see how much graduates earn from over 36,000 undergraduate programs.
College is one of the most expensive endeavors a person will pursue, and for lower-income students the costs can be especially daunting. In this data download, see the out-of-pocket costs (“net price”) institutions estimate for their lower- and higher-income students.
A list of the most expensive U.S. colleges, ordered by annual “net price,” the total out-of-pocket cost students must cover through personal funds or loans. It also shows each institution’s undergraduate enrollment and annual federal student aid, using U.S. Department of Education data.